
- The US Dollar Index gains ground to near 103.60 in Tuesday’s early European session, up 0.14% on the day.
- The negative outlook of the index remains in play with a bearish RSI indicator.
- The first support level to watch is 103.35; the immediate resistance level is seen at 104.10.
The US Dollar Index (DXY), an index of the value of the US Dollar (USD) measured against a basket of six world currencies, recovers some lost ground to near 103.60 during the early European session on Tuesday. The potential upside for the Greenback might be limited amid fears that US President Donald Trump’s tariff policies could trigger a broader economic slowdown.
The US Federal Reserve (Fed) interest rate decision will be in the spotlight on Wednesday, with no change in rate expected. According to the CME FedWatch tool, the markets have priced in nearly 60% chance of rate cuts, a little over two reductions, for the rest of the year.
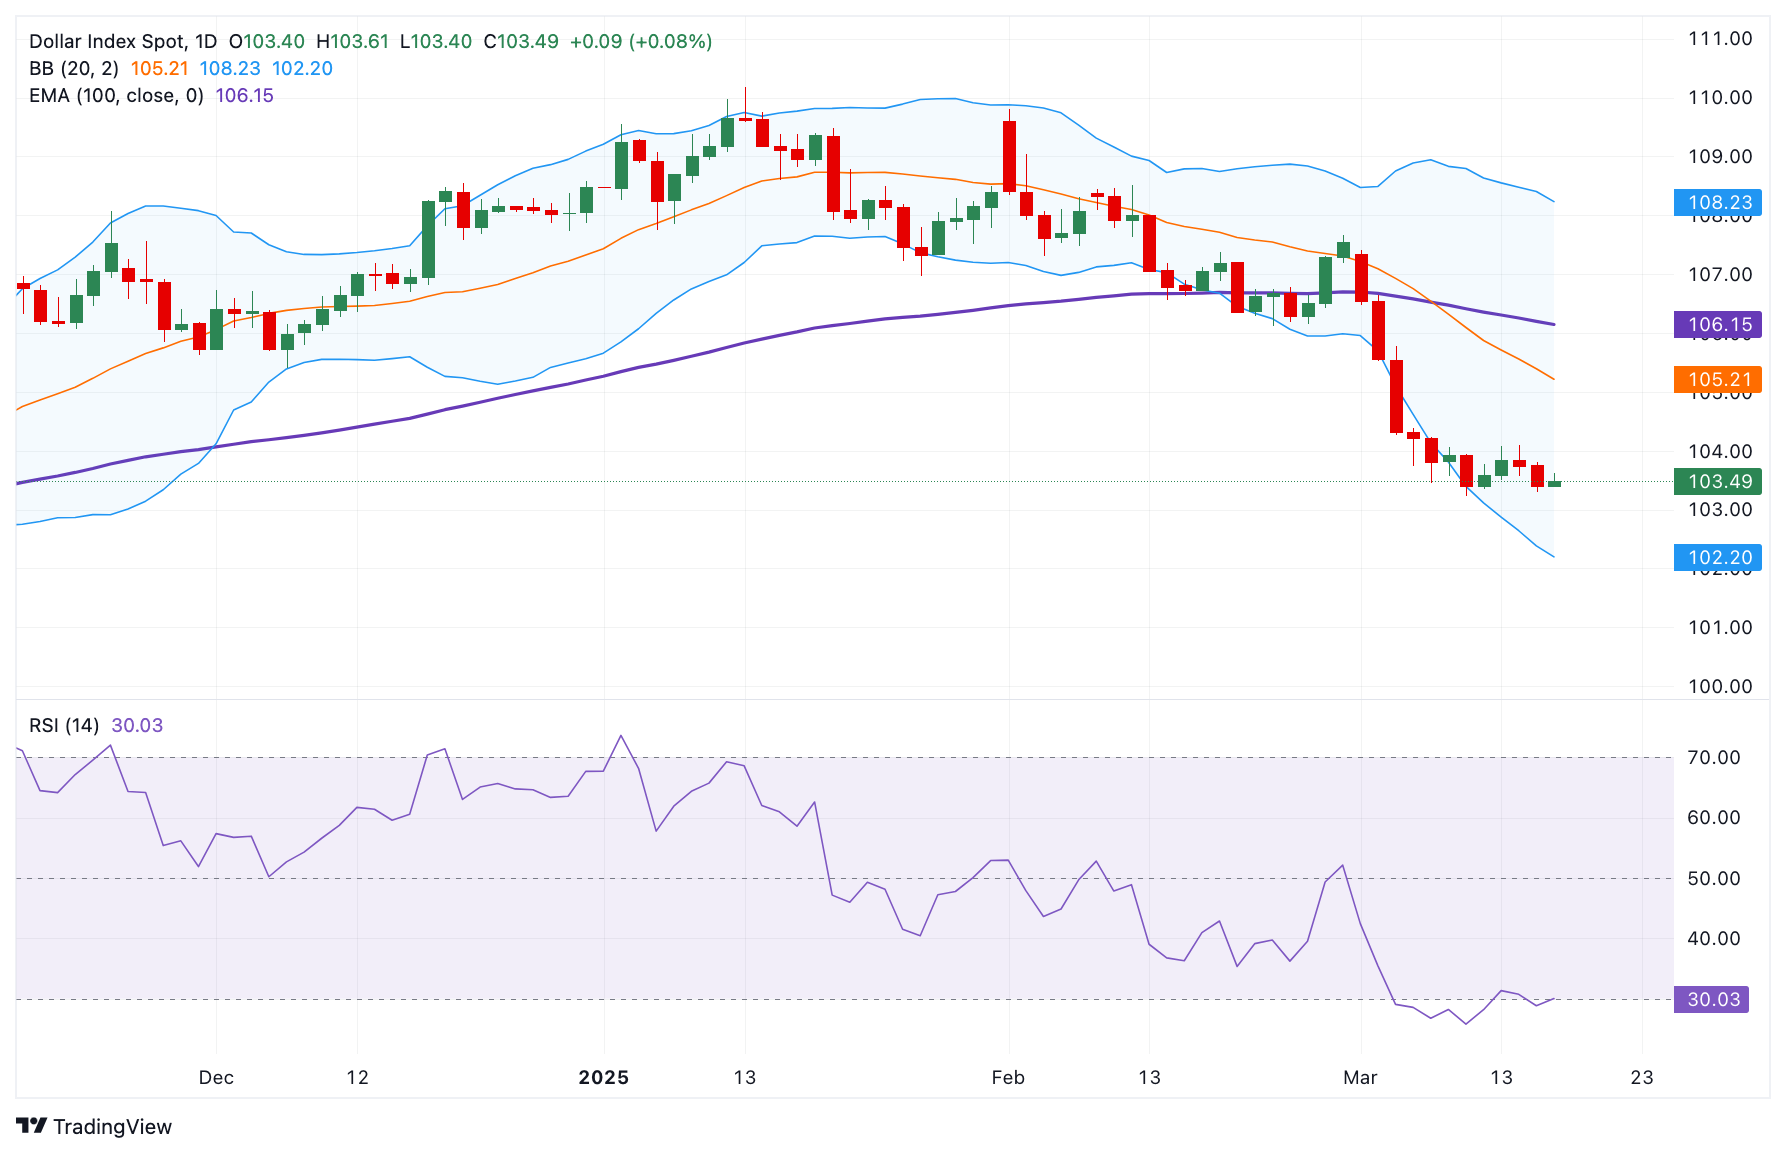
According to the daily chart, the bearish sentiment of the DXY remains intact as the index holds below the key 100-day Exponential Moving Average (EMA). Furthermore, the downward momentum is supported by the 14-day Relative Strength Index (RSI), which stands below the midline near 31.50, supporting the sellers in the near term.
The initial support level for the USD index emerges at 103.35, the low of March 17. Further south, the next contention level is seen at 102.20, the lower limit of the Bollinger Band. The additional downside filter to watch is 100.53, the low of August 28, 2024.
On the bright side, the first upside barrier for the DXY is located at 104.10, the high of March 14. Any follow-through buying above this level could pave the way to 106.15, the 100-day EMA. A decisive break above the mentioned level could see a rally to 107.38, the high of February 19.
US Dollar Index (DXY) daily chart
US Dollar FAQs
The US Dollar (USD) is the official currency of the United States of America, and the ‘de facto’ currency of a significant number of other countries where it is found in circulation alongside local notes. It is the most heavily traded currency in the world, accounting for over 88% of all global foreign exchange turnover, or an average of $6.6 trillion in transactions per day, according to data from 2022. Following the second world war, the USD took over from the British Pound as the world’s reserve currency. For most of its history, the US Dollar was backed by Gold, until the Bretton Woods Agreement in 1971 when the Gold Standard went away.
The most important single factor impacting on the value of the US Dollar is monetary policy, which is shaped by the Federal Reserve (Fed). The Fed has two mandates: to achieve price stability (control inflation) and foster full employment. Its primary tool to achieve these two goals is by adjusting interest rates. When prices are rising too quickly and inflation is above the Fed’s 2% target, the Fed will raise rates, which helps the USD value. When inflation falls below 2% or the Unemployment Rate is too high, the Fed may lower interest rates, which weighs on the Greenback.
In extreme situations, the Federal Reserve can also print more Dollars and enact quantitative easing (QE). QE is the process by which the Fed substantially increases the flow of credit in a stuck financial system. It is a non-standard policy measure used when credit has dried up because banks will not lend to each other (out of the fear of counterparty default). It is a last resort when simply lowering interest rates is unlikely to achieve the necessary result. It was the Fed’s weapon of choice to combat the credit crunch that occurred during the Great Financial Crisis in 2008. It involves the Fed printing more Dollars and using them to buy US government bonds predominantly from financial institutions. QE usually leads to a weaker US Dollar.
Quantitative tightening (QT) is the reverse process whereby the Federal Reserve stops buying bonds from financial institutions and does not reinvest the principal from the bonds it holds maturing in new purchases. It is usually positive for the US Dollar.
Information on these pages contains forward-looking statements that involve risks and uncertainties. Markets and instruments profiled on this page are for informational purposes only and should not in any way come across as a recommendation to buy or sell in these assets. You should do your own thorough research before making any investment decisions. FXStreet does not in any way guarantee that this information is free from mistakes, errors, or material misstatements. It also does not guarantee that this information is of a timely nature. Investing in Open Markets involves a great deal of risk, including the loss of all or a portion of your investment, as well as emotional distress. All risks, losses and costs associated with investing, including total loss of principal, are your responsibility. The views and opinions expressed in this article are those of the authors and do not necessarily reflect the official policy or position of FXStreet nor its advertisers. The author will not be held responsible for information that is found at the end of links posted on this page.
If not otherwise explicitly mentioned in the body of the article, at the time of writing, the author has no position in any stock mentioned in this article and no business relationship with any company mentioned. The author has not received compensation for writing this article, other than from FXStreet.
FXStreet and the author do not provide personalized recommendations. The author makes no representations as to the accuracy, completeness, or suitability of this information. FXStreet and the author will not be liable for any errors, omissions or any losses, injuries or damages arising from this information and its display or use. Errors and omissions excepted.
The author and FXStreet are not registered investment advisors and nothing in this article is intended to be investment advice.